Analyze a KIMMDY run
Through kimmdy-analysis, several tools are provided to analyze various aspects of KIMMDY runs.
Energy
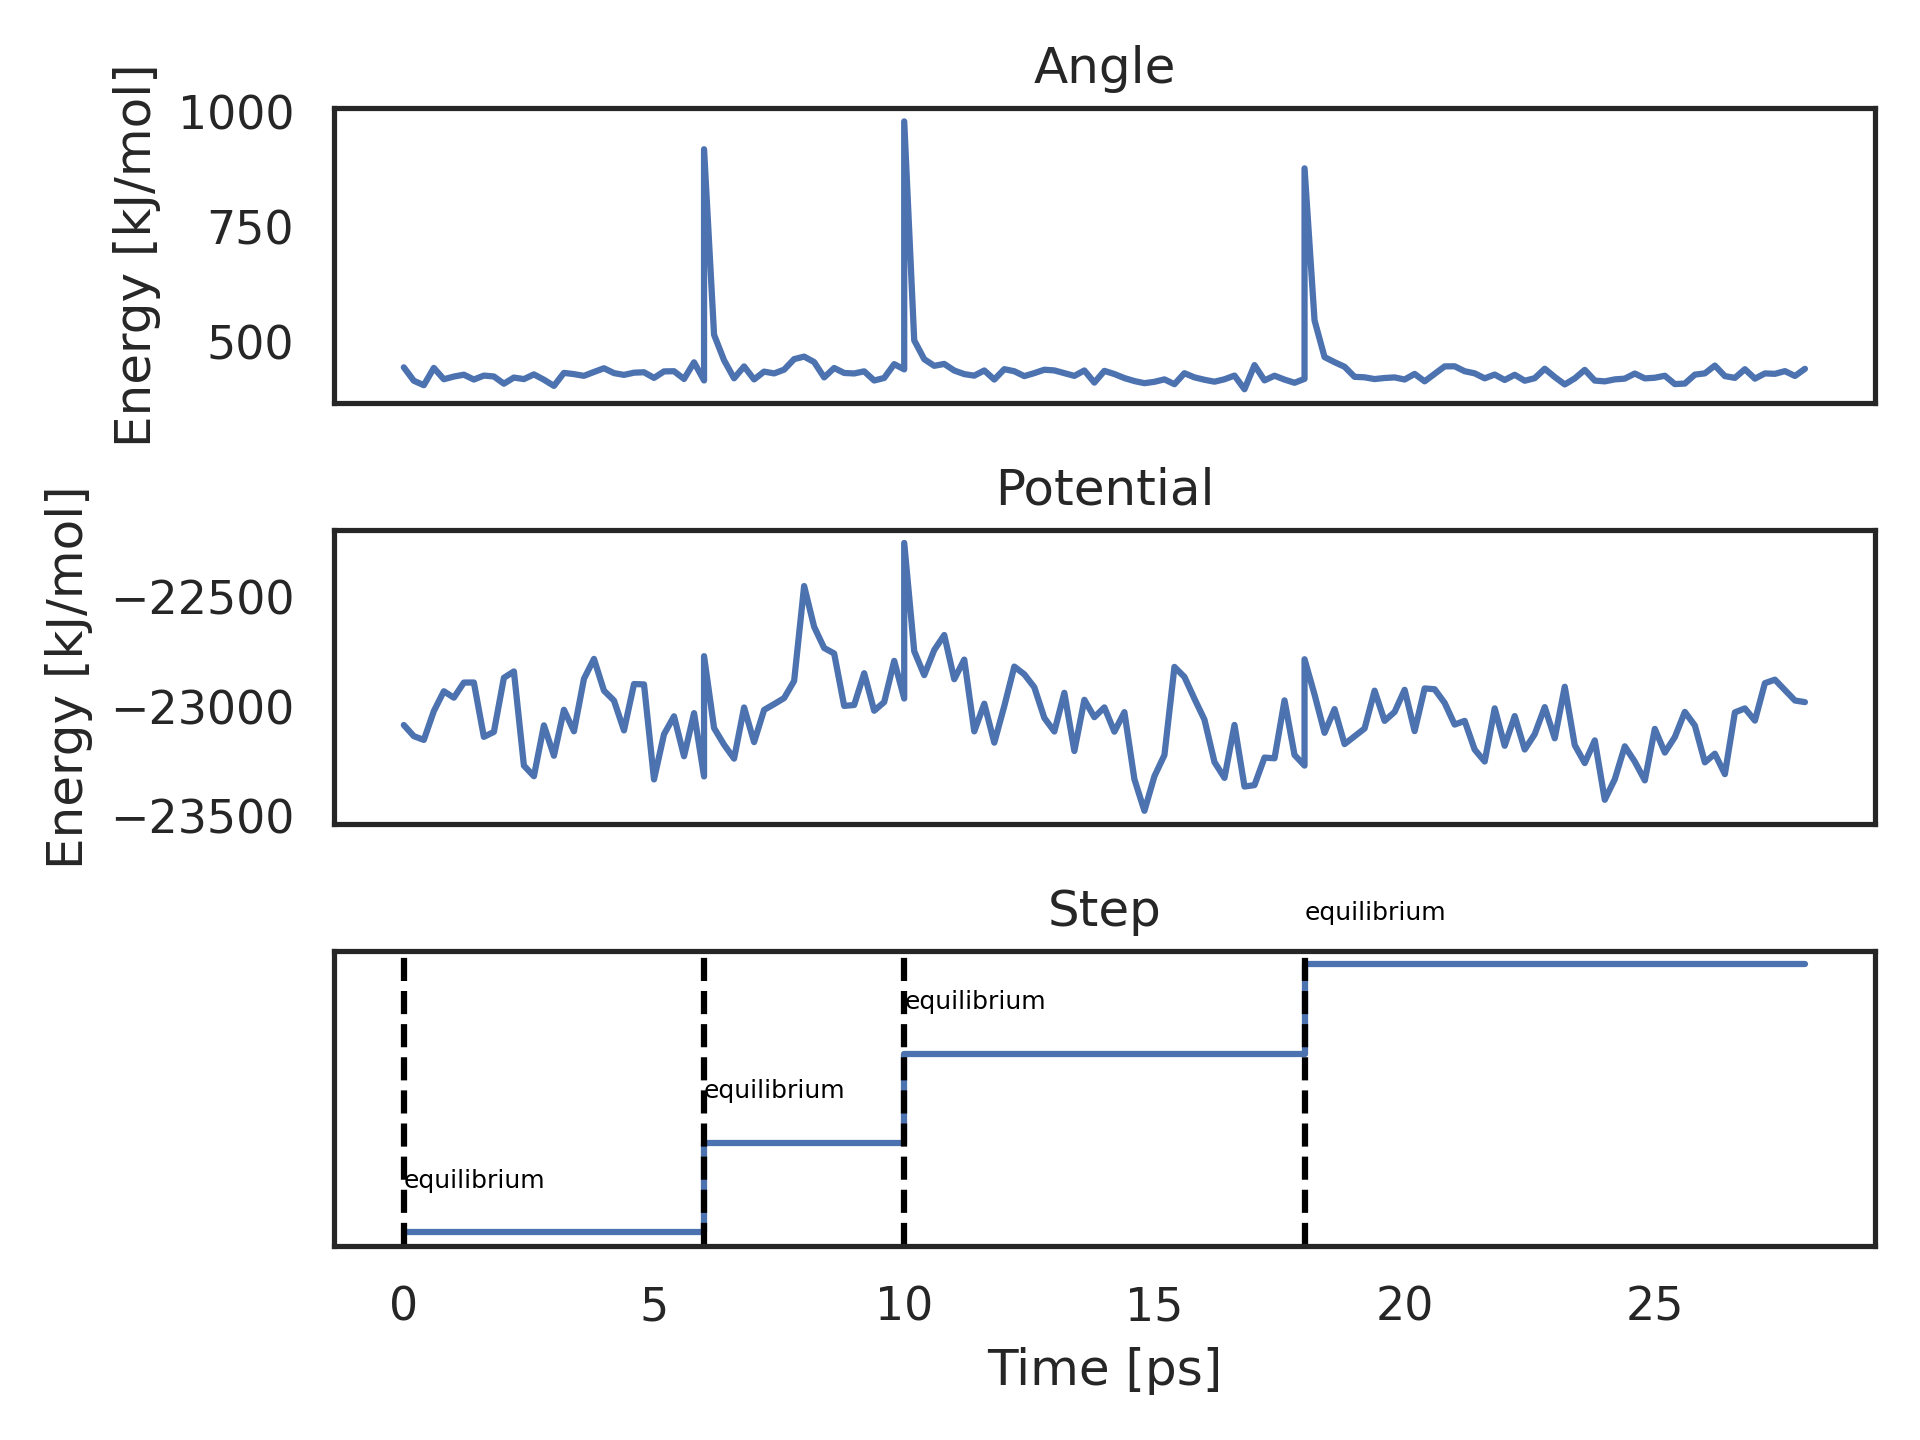
kimmdy-analysis energy sets the usual energy analysis by gmx energy into the context of KIMMDY, by showing the KIMMDY MD steps next to the energy plot. An example KIMMDY run of three HAT reactions is shown below.
All energy terms supported in the GROMACS tool gmx energy can be plotted. The lowest plot shows which KIMMDY MD run is running at a given time. Here, three HAT reactions are performed, each in between two equilibrium MD simulations.
Radical Occupancy
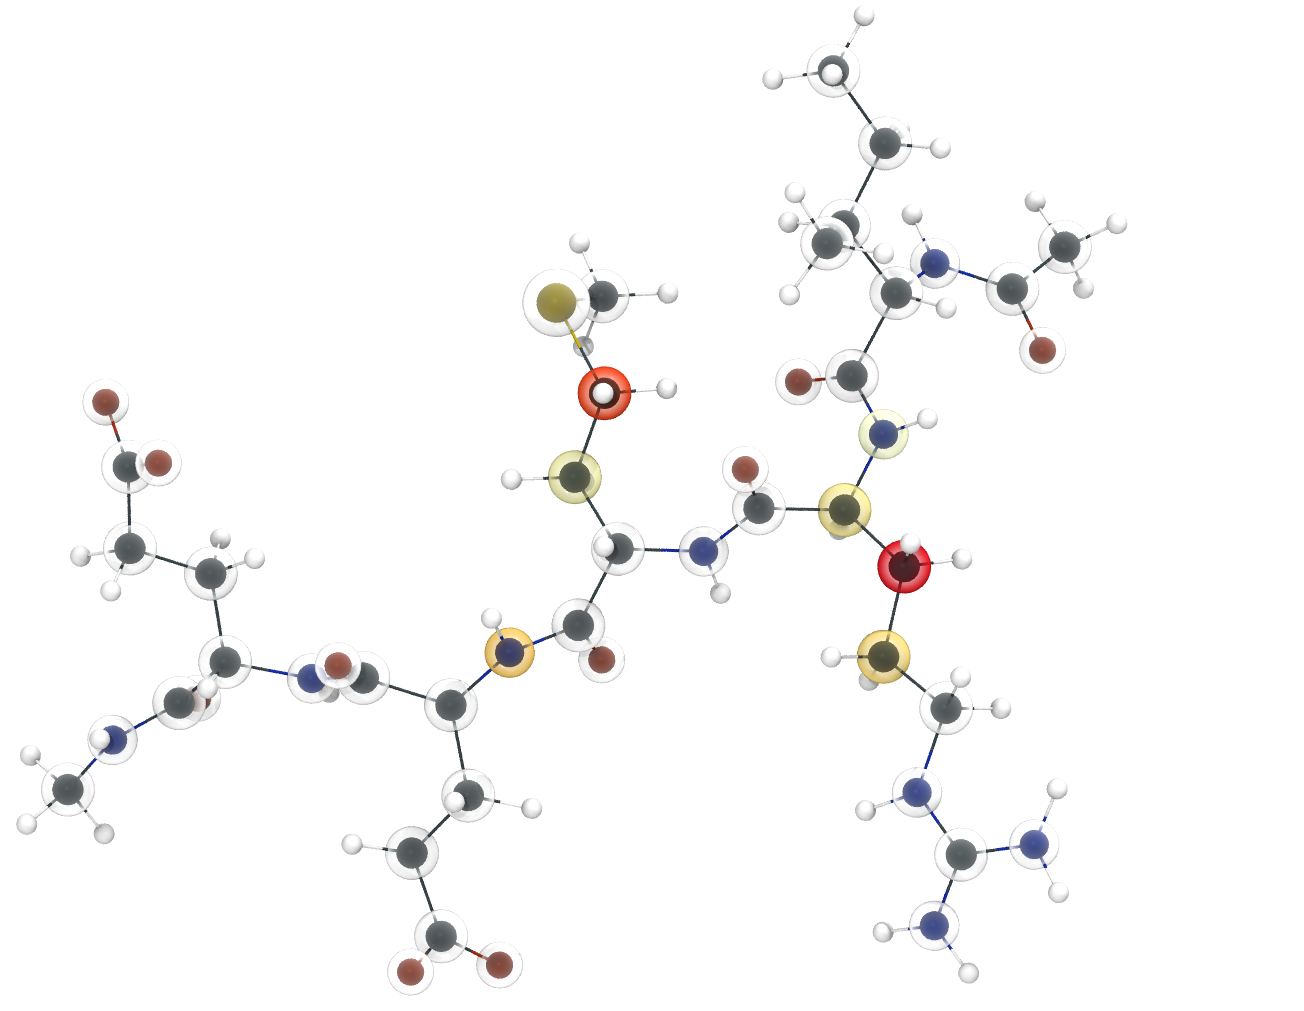
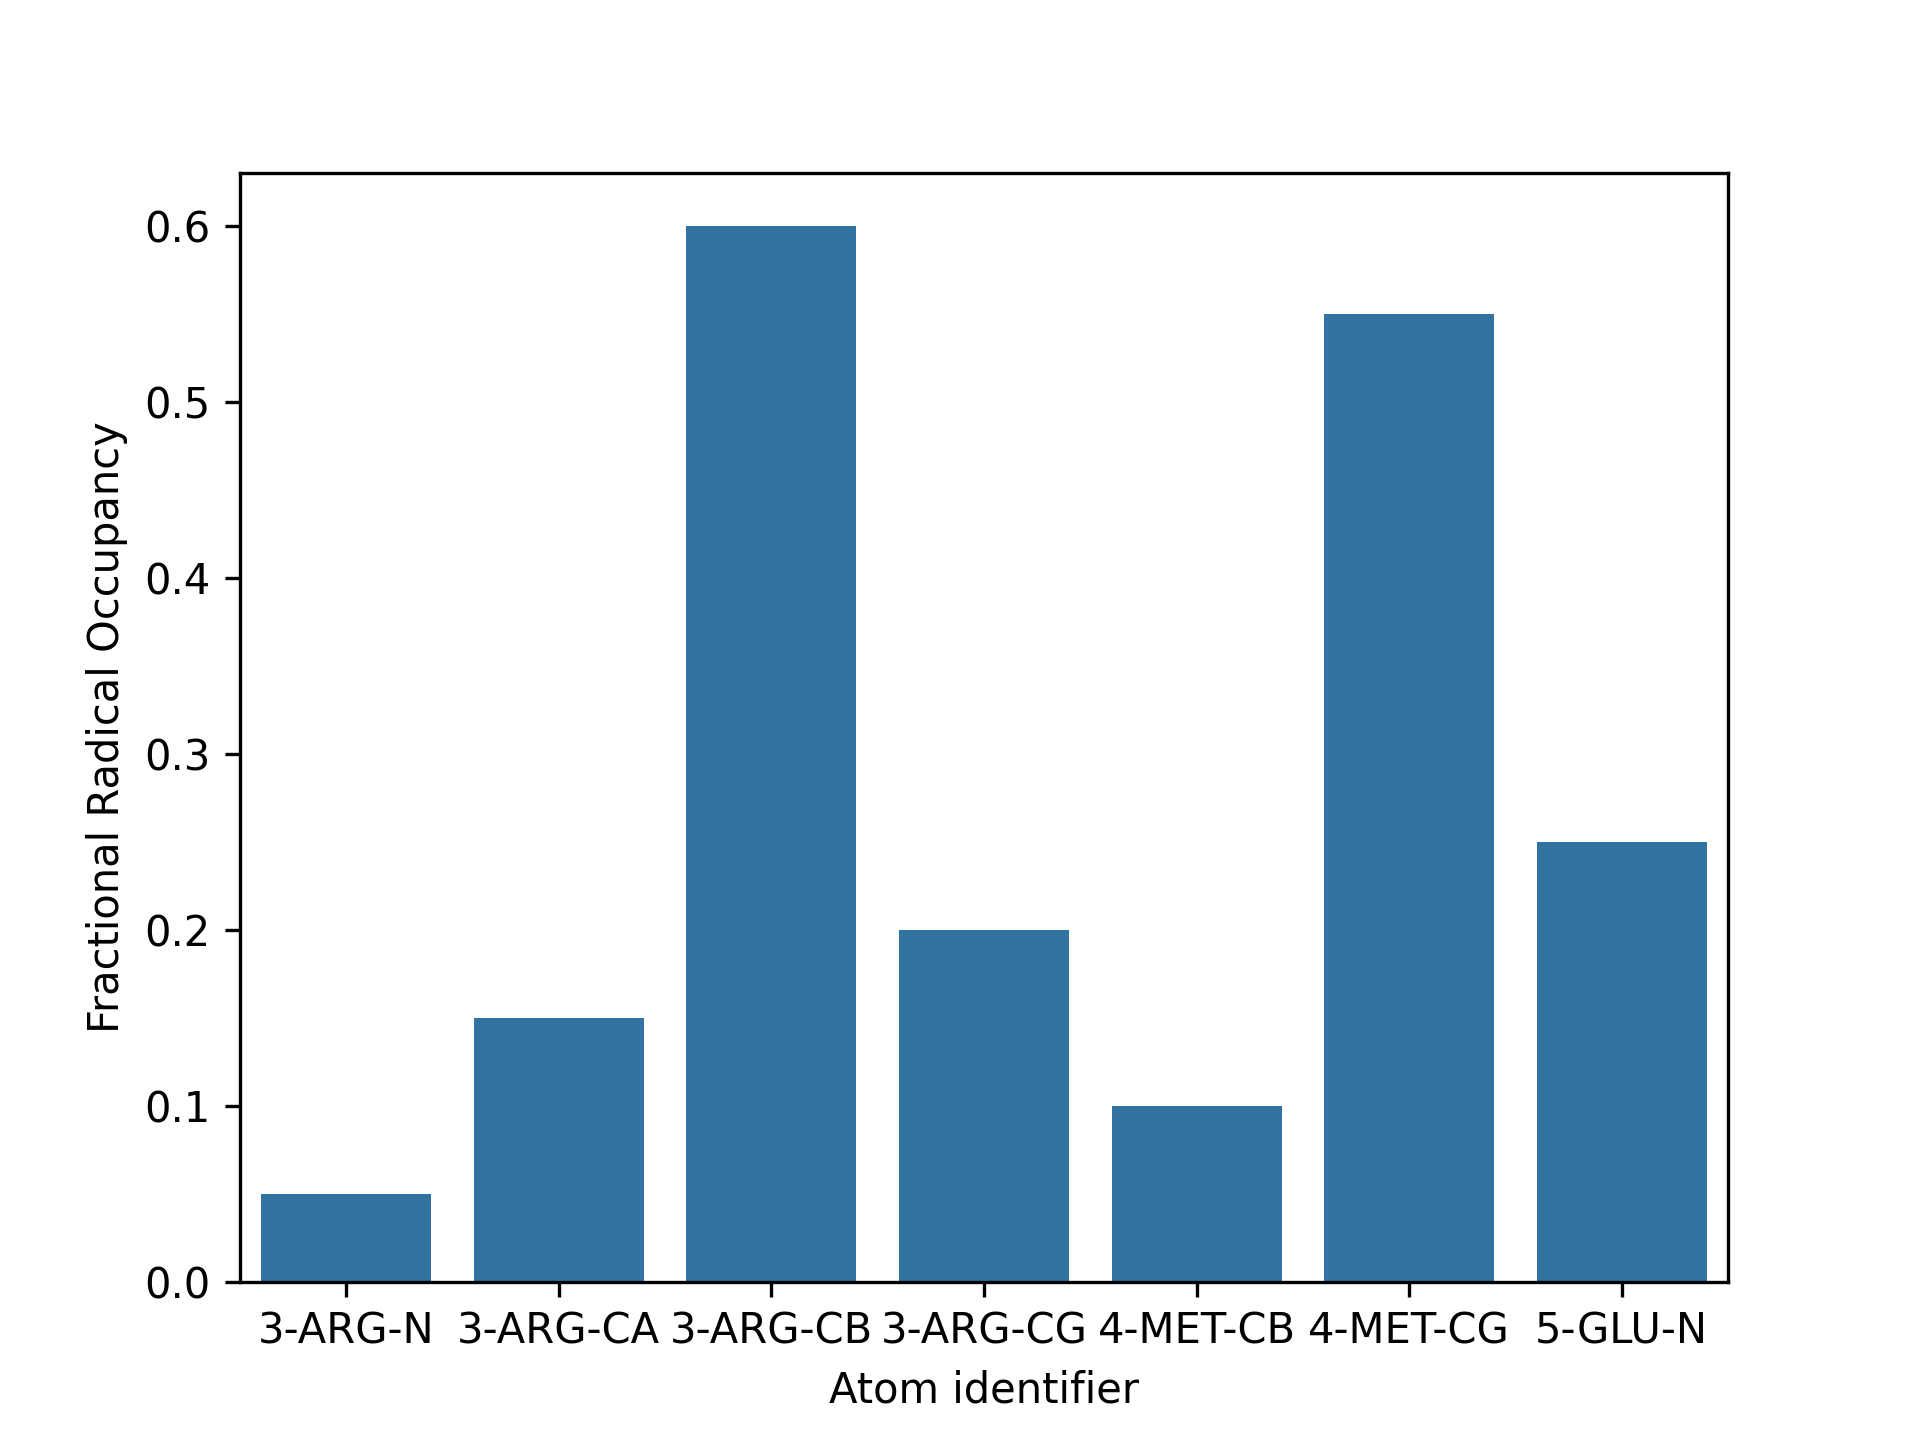
kimmdy-analysis radical_population analyzes where, and for how long radi- cals are in the system. The resulting statistic can be visualized in two ways. First, as values on a three-dimensional snapshot of the system, as shown in below. For this, a pdb file of the structure is generated, containing the calculated radical occupancy as its beta value for visualization with established software, like vmd. And second, as a bar plot of the fractional radical occupancy per atom. Depending on the number of involved atoms, the structure, or the bar plot might be more useful.
Radical Migrations
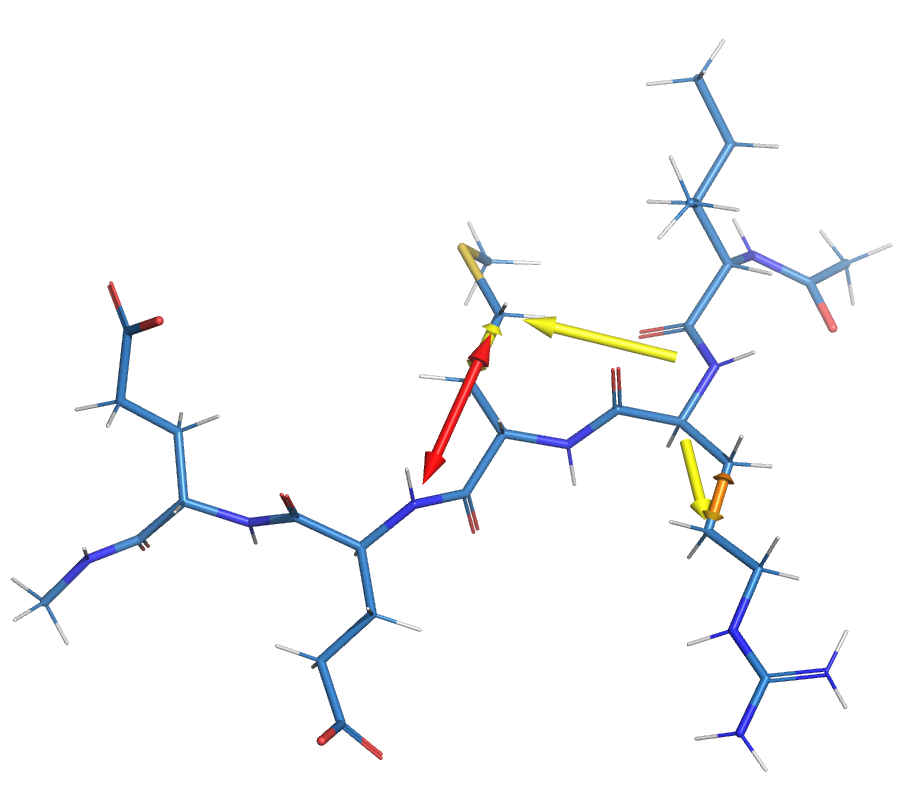
The kimmdy-analysis radical_migration tool can generate visualizations. Depicting between which atoms HAT reactions occur. The arrows can be colored according to the number of HAT reactions, or the maximum rate for the respective transition.
Reaction Rates
kimmdy-analysis rates can generate plots of all available rates entering a kMC step. By default, KIMMDY generates in the kMC step of every reaction a plot, showing calculated rates over the course of the latest simulation. This can be turned off in the input yaml. If in the kMC step a reaction is chosen, the corresponding rates are highlighted bold and dashed. Each reaction recipe has a string representation, consisting of the involved atom numbers and symbols for the actions. Bonds breaking are depicted as bolt. A new bond, and a movement are both represented with an arrow.

Runtimes
kimmdy-analysis runtime analyzes the runtime of kimmdy. Besides showing the runtime of all tasks performed it can group tasks, and types of tasks together. The example analyzes the runtime of KIMMDY performing 20 consecutive HAT reactions after an initial homolysis reaction. As the simulated system is quite small (the charged_peptide example is used), the MD simulations are comparatively fast. For bigger systems, the MD runtime will increase, while the time required for HAT reaction barrier predictions will not, as it only atoms close to a radical are taken into account. Therefore, the computational overhead of KIMMDY should be negligible in most use cases.

